Hemodynamic Simulation for Echocardiography
Hemodynamic models, due to their complexity, pose challenges for clinicians in deriving essential insights that link clinical issues with these models. The most effective method to demonstrate a hemodynamic equation is through visualization. Simulating these models to show how variations in the equation's coefficients affect outcomes is crucial. Therefore, the effectiveness of hemodynamic software hinges on its user-friendliness in visualizing these models and its efficacy in enabling clinicians to glean meaningful insights from them. In discussing the inherent limitations and practical applications of these models, it is essential to recall a famous maxim by statistician George Box. He succinctly observed that 'all models are wrong, but some are useful.' This principle underscores that while no model can perfectly capture the complexities of the real world, they can still serve as invaluable tools for understanding and prediction.
Below is a practical example illustrating the clinical application of hemodynamic simulation: the development of a logistic-based equation for estimating Pulmonary Artery Pressure (PAP), grounded in a hemodynamic model (Frank, 2018):
Inducing Logistic-based PAP estimation equation (Frank, 2018):
- A logical ground for the relationship between systolic pulmonary artery pressure (PAP) and pulmonary acceleration time (PAcT) using transthoracic echocardiography was established based on a logistic-based systolic model.
- The logistic-based PAP estimation equation was deduced from the model to relate systolic PAP and PAcT.
- Results showed that the logistic-based PAP estimation equation was at least as accurate as previous equations with respect to previously published mean PAP versus PAcT values.
(0) Preface
As a hemodynamic software architect, my focus is on making the valuable insights from hemodynamic studies more accessible and intuitive for clinicians. Although working directly with hemodynamic models can be challenging due to their complex variables and intricate expressions, the key lies in effective visualization. By visually representing these models, the significance of each variable becomes clearer, facilitating their application in addressing clinical queries. My role is not to create hemodynamic models but to adapt and apply them in clinical settings, integrating them with device programming and machine learning. I aim to demonstrate how slight modifications to these models can have practical clinical applications, thereby bridging the gap between complex hemodynamic theories and everyday clinical practice.
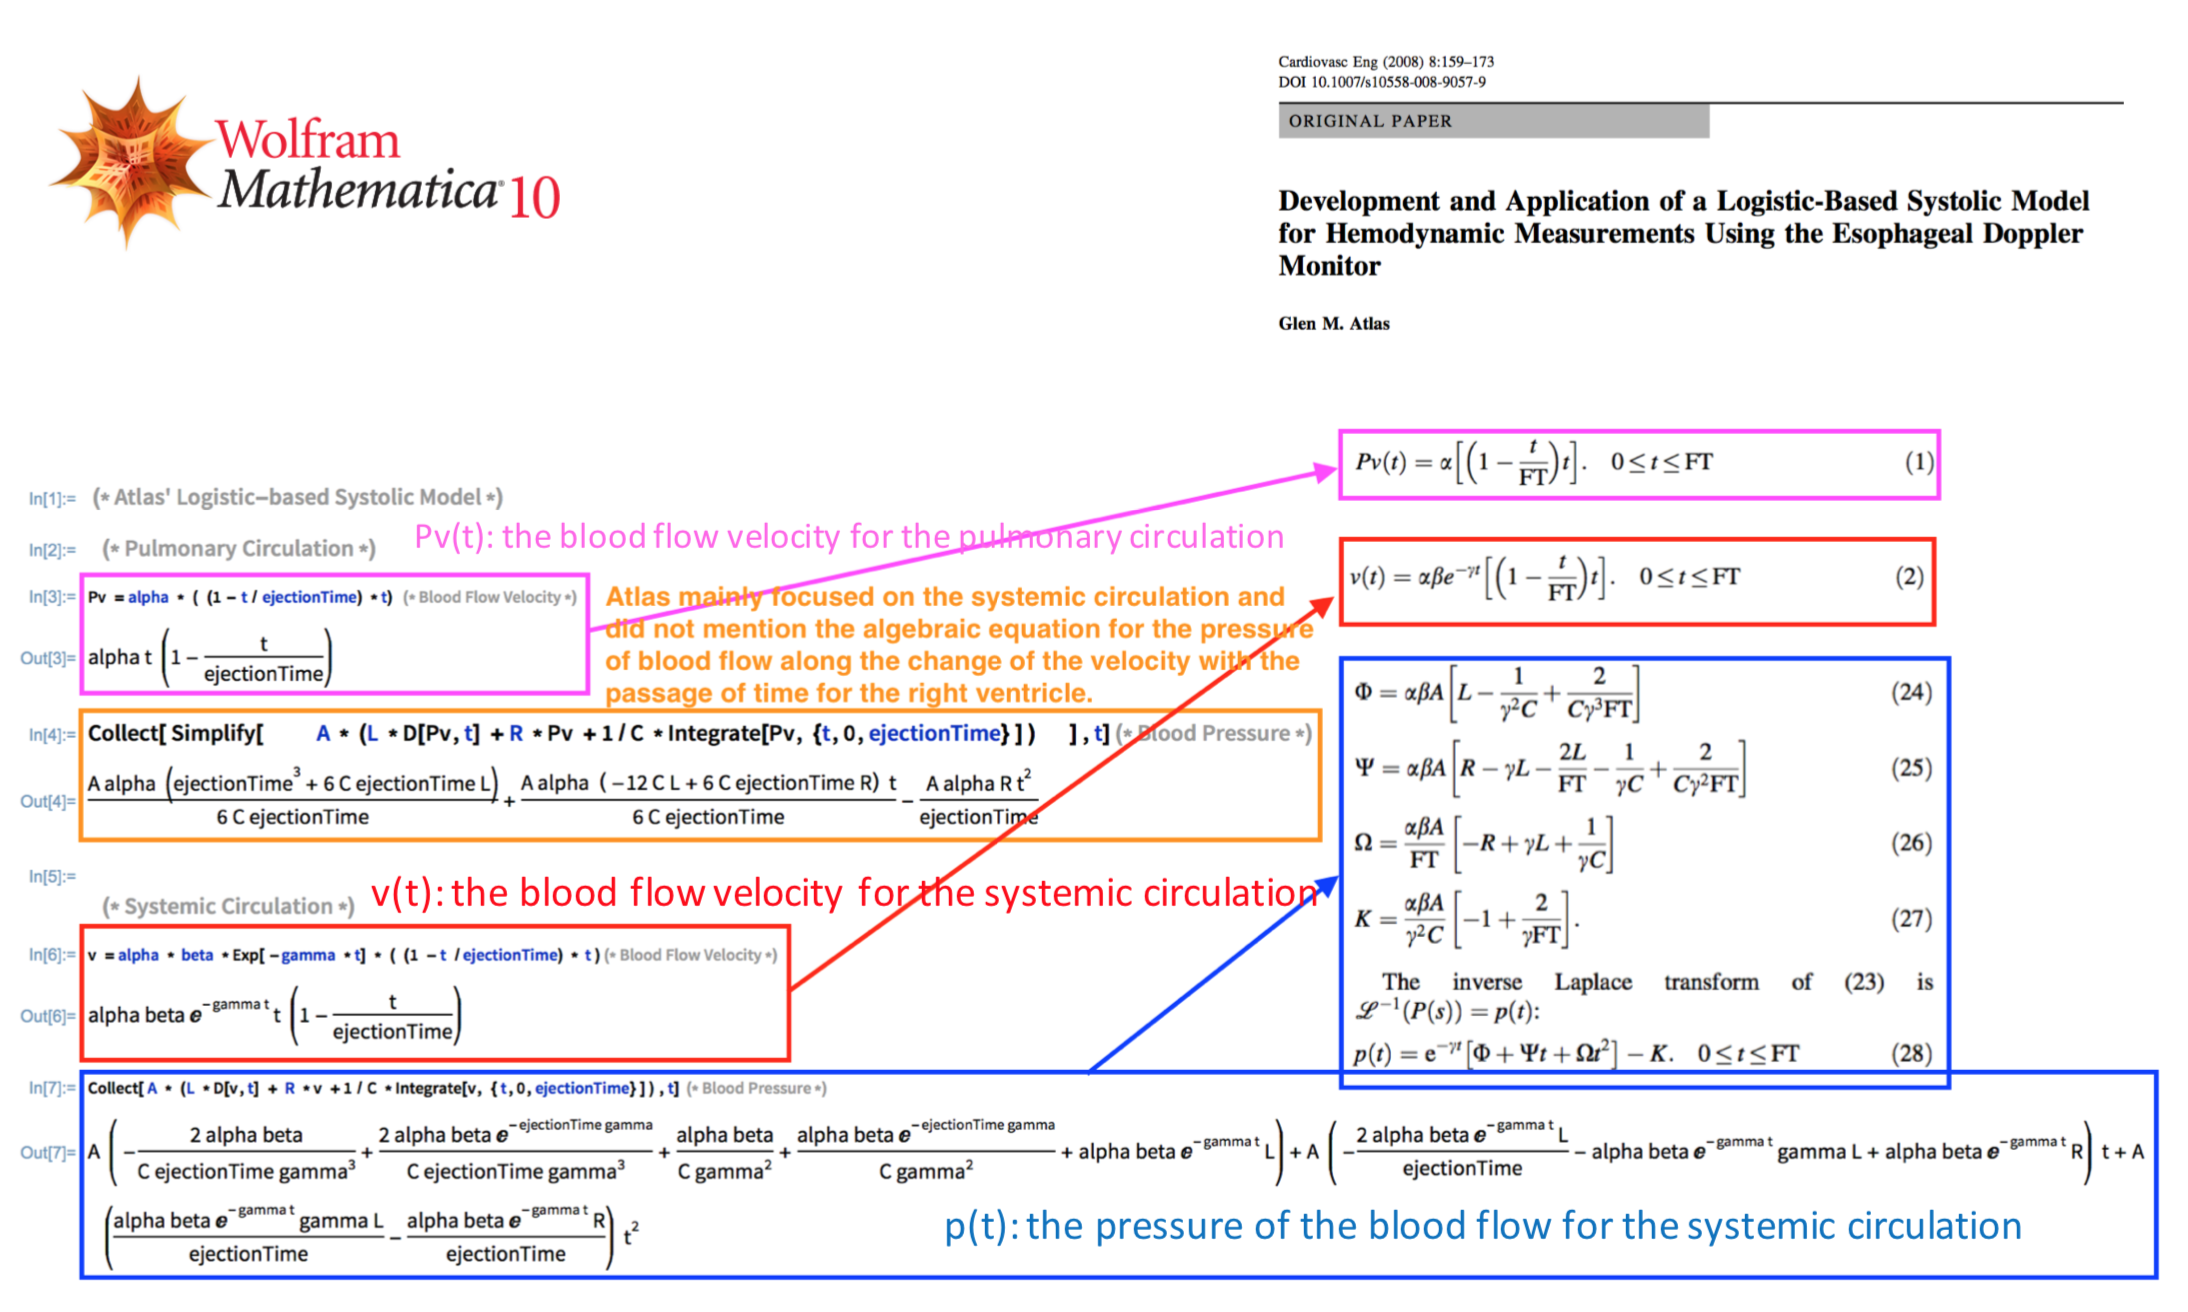
Logistic-based systolic model (Atlas, 2008) was developed to reflect aortic blood flow velocity and pressure that were observed by esophageal Doppler monitor (EDM). "As every model somehow simplifies the physiologies, any model may be modified or expanded for a certain purpose or application. This hemodynamic model requires a minor modification to better reflect the pulmonary circulation physiologies and to support the relationship between PAcT and PAP" (Frank, 2018).
LBSM has the following aspects that should be improved for the pulmonary circulation:
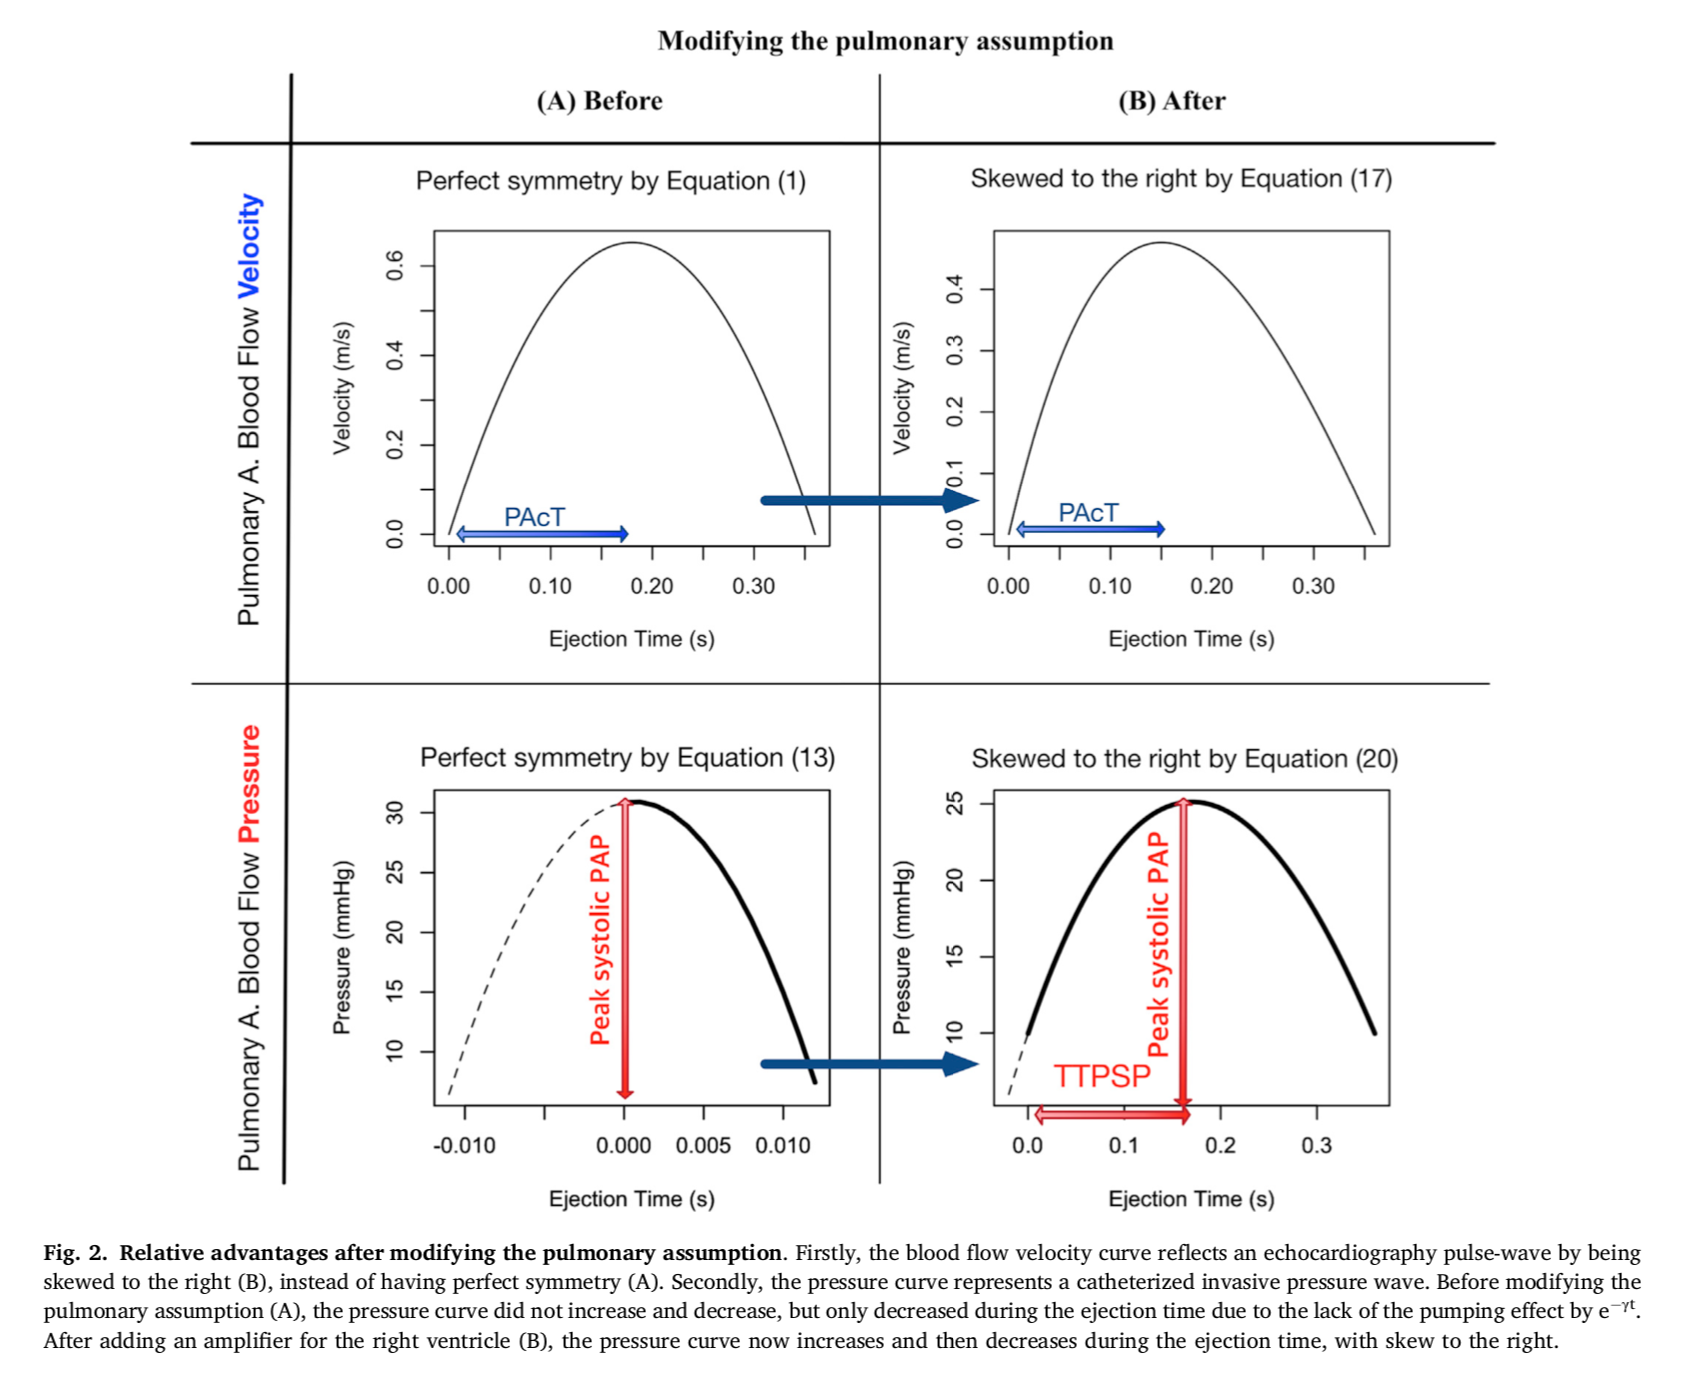
a) Blood flow velocity: Pv(t) = α∙((1 - t/ET)∙t) Perfect symmetry -> Skewed to the right
Skewedness, observed by Echocardiography, is a key characteristic, which reflects the relationship between pulmonary acceleration time (PAcT) and pulmonary arterial pressure (PAP).
b) Blood flow pressure: v(t) = Φ + Ψ∙t + Ω∙t2 Perfect symmetry -> Skewed to the right
The overall skewed shape of pressure curve, observed by Catheterization, is critical in mathematically integrating area under the curve for diagnosing PAP per the definition of pulmonary hypertension.
c) Correlation between PAP and PAcT: Pv'(t) = α∙(1-2/ET∙t)
According to LBSM (Atlas, 2008), since the blood flow velocity waveform is a quadratic function with a perfect symmetry with respect to t = ET/2, no correlation between PAP (pulmonary artery pressure) and PAcT (pulmonary arterial acceleration time) should be observed. This is, in fact, not the case, based on significantly high correlation between PAP and PAcT in (Kitabatake, 1983) and (Dabestani, 1987).
d) Assumption of LBSM
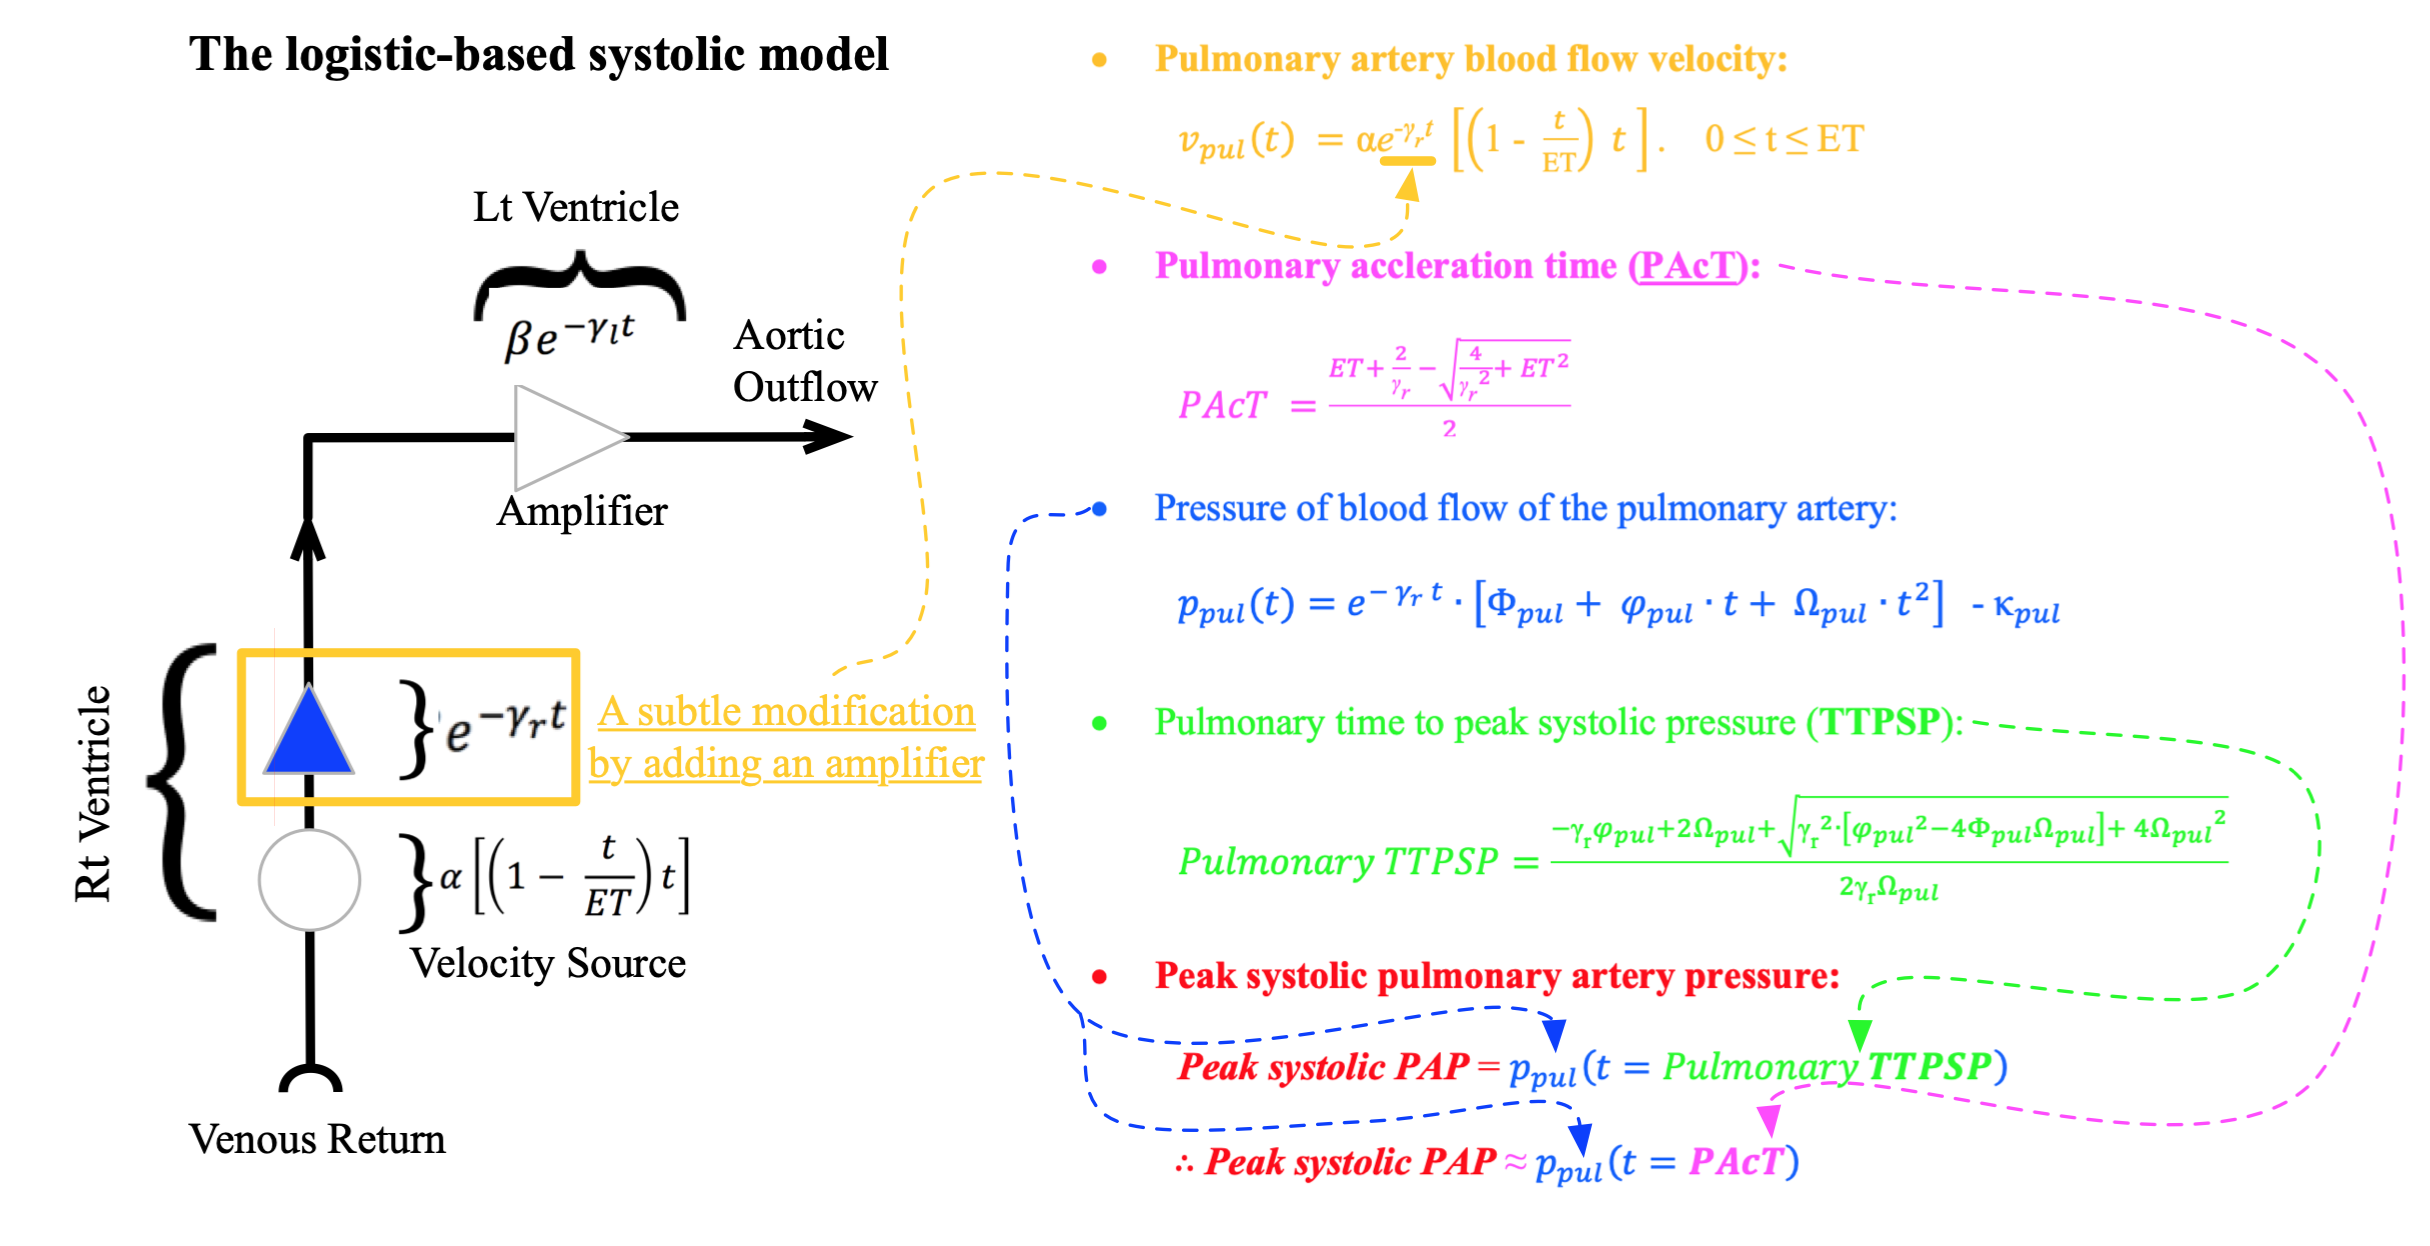
No pumping effect was previously assumed for the pulmonary circulation (Atlas, 2008). "Despite the fact that RV pumps weakly compared to LV, to better reflect pulmonary physiologies, such as the correlation between PAP and PAcT and the skeness of velocity and pressure curve of pulmonary circulation, it is necessary to assume a pumping effect on pulmonary circulation as well" (Frank, 2018).
A subtle modification was made by adding an amplifier for the pulmonary circulation. The right ventricle acts as a velocity source and an amplifier, whereas the left ventricle plays the role of an amplifier. In this model, e-γr*t and e-γl*t are employed to reflect the pumping effect of the right and left ventricles, respectively.
e) Re-inducing the LBSM model, based on the subtly modified assumption, by Mathematica
Collect [ Simplify [A * (L * D[Pv, t] + R * Pv + 1/C * Integrate [Pv, {t, 0, ET}] ), t]

(2) Establishing Logistic-based PAP Estimation Equation

a) Simulated results of the logistic-based systolic model
The model (Atlas, 2008) was modified to reflect pulmonary circulation physiology in relation to systemic circulation.
Then, the model (Frank, 2018) could represent both circulation physiologies, by being capable of better resembling actual blood flow velocity and pressure curves.
b) Observational measurements of mammals, redrawn from Figure 4.2.2. of Li.
For pulmonary circulation, the difference between aortic acceleration time (AcT) and time to peak systolic pressure (TTPSP) is relatively small compared to that of the less compliant systemic circulation.
Thus, the relationship between pulmonary acceleration time (PAcT) and PAP can be induced by substituting TTPSP, which requires invasive catheterized measurements, with PAcT, which can be measured by transthoracic echocardiography.
Per the Equation: Systolic PAP = p(time), the systolic PAP can be approximately equal to the function of PAcT.
(3) Evaluating Logistic-based PAP Estimation Equation
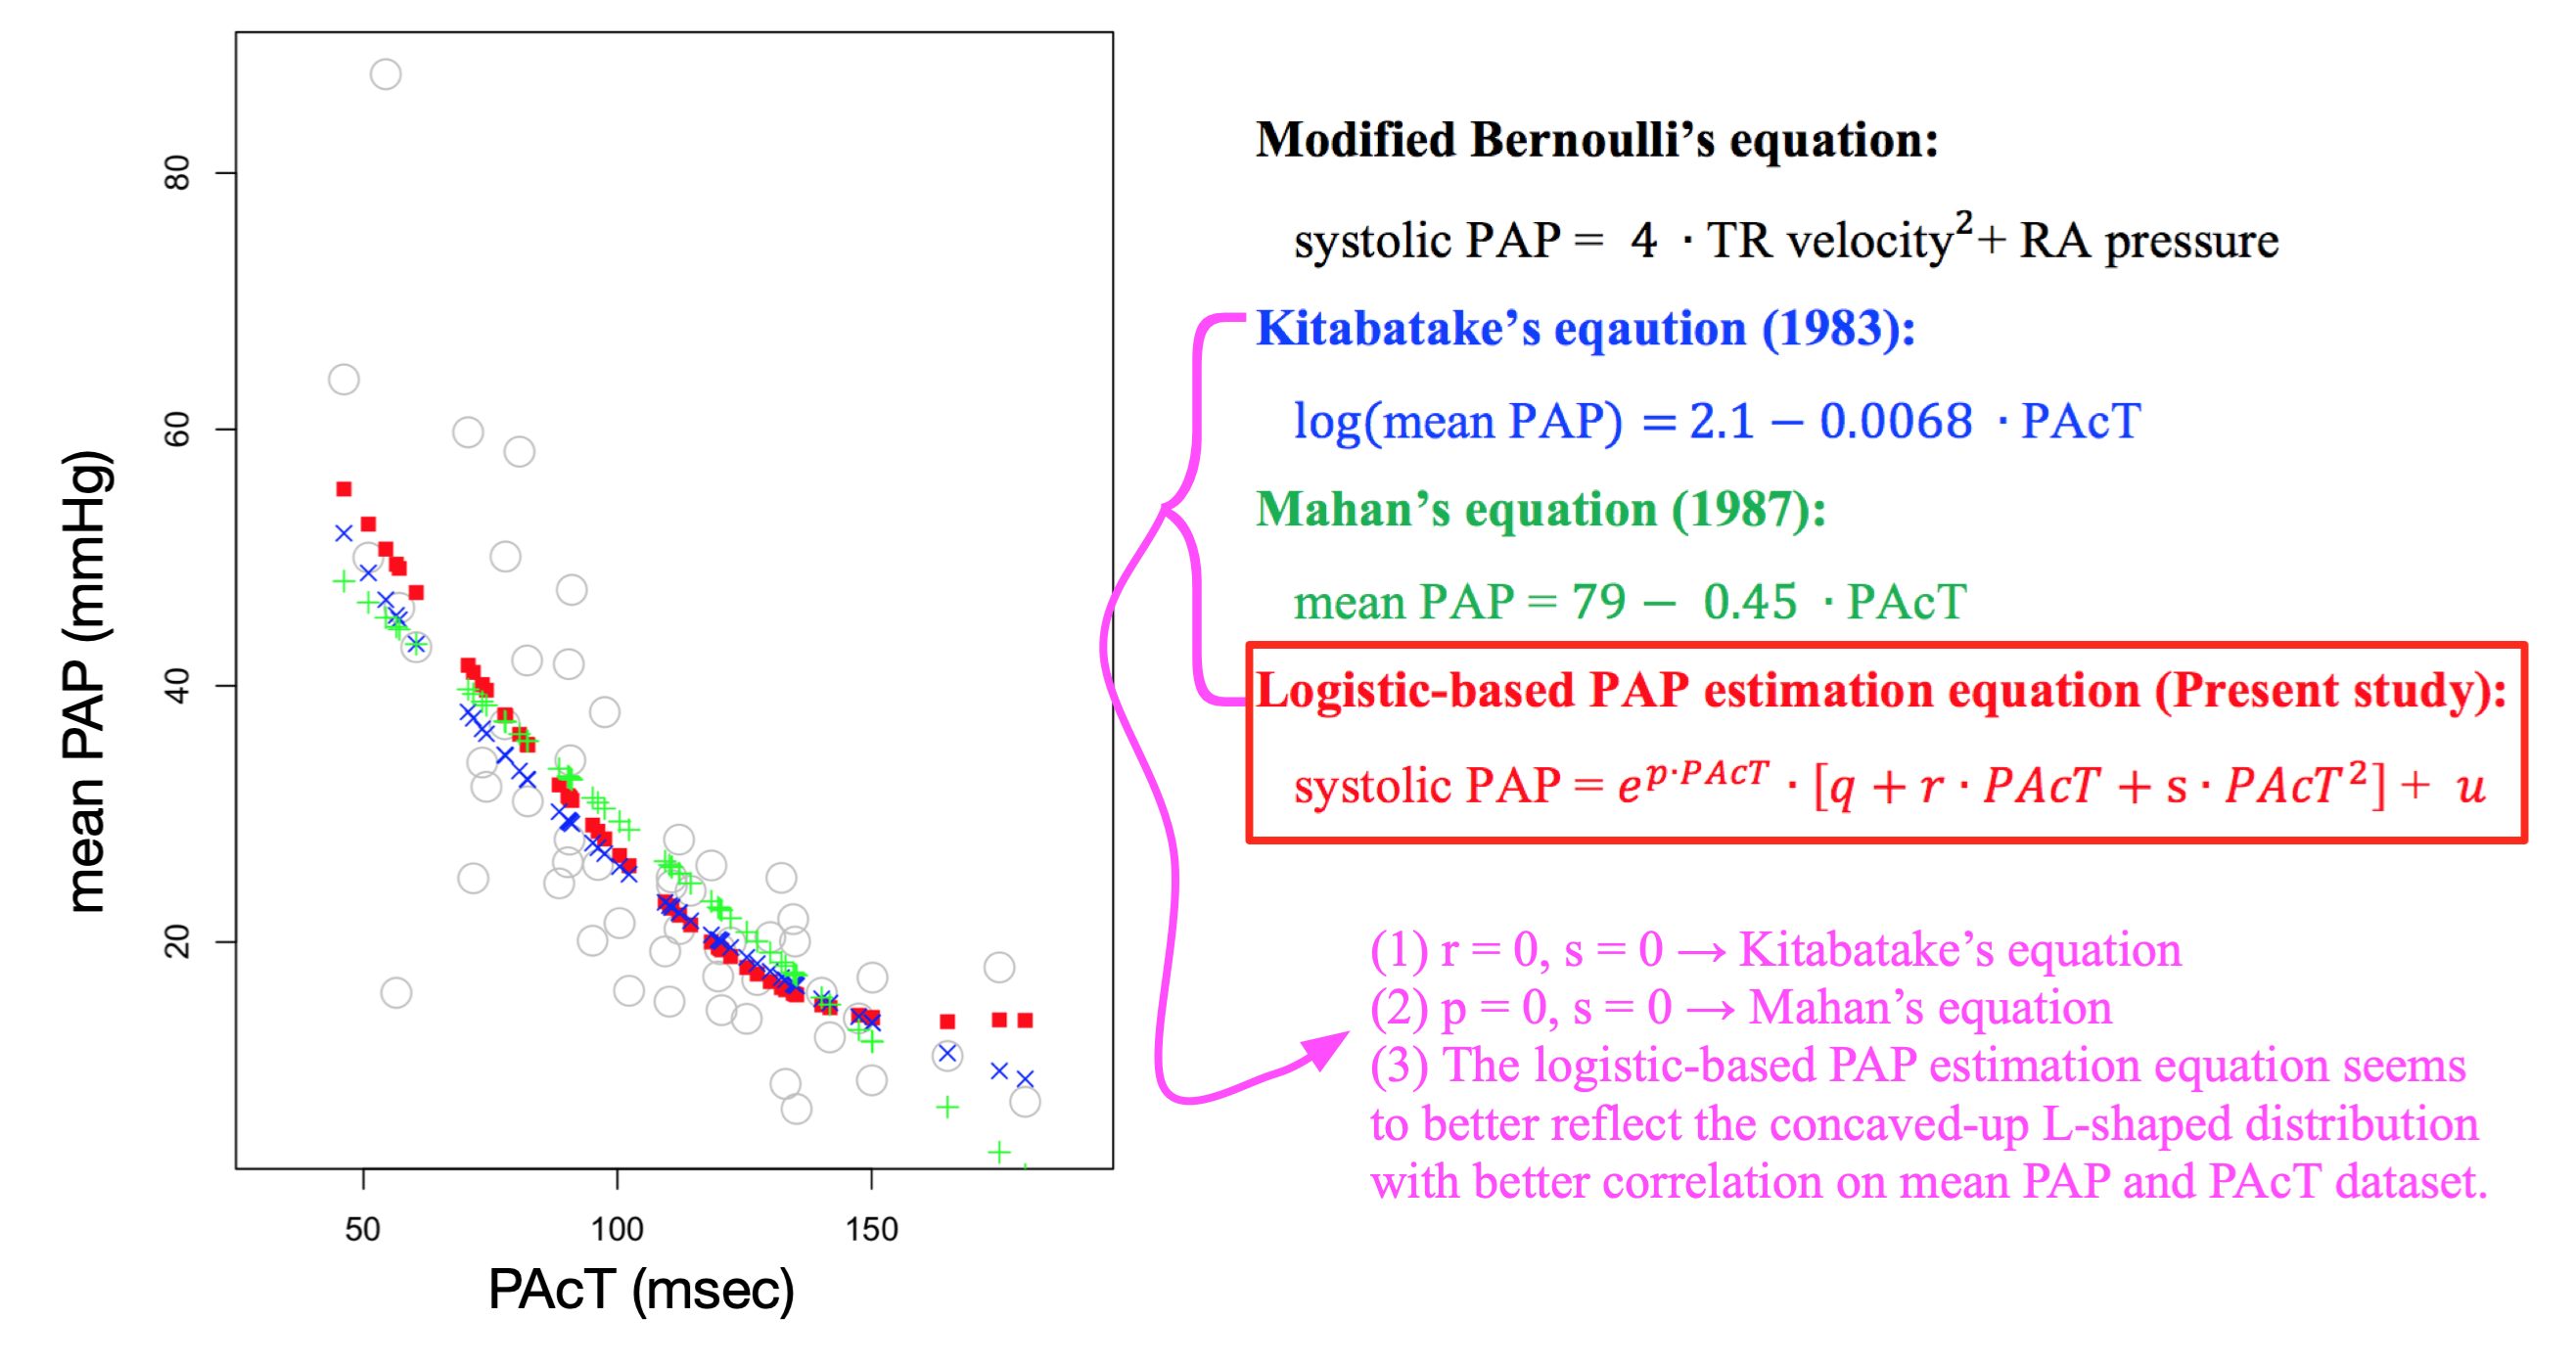
The mean PAP and PAcT pair values, gathered from Dabestani et al., Kitabatake et al., and Tousignant et al., were employed. The overall distribution between mean PAP and PAcT did not appear to be linear, but rather L-shaped. The predicted values for the linear Mahan's relationship, the logarithmic Kitabatake's relationship, and the proposed logistic-based relationship were represented, respectively, whose Pearson correlation coefficients were 0.749, 0.779, and 0.781 and the corresponding p-values were below 0.05.
Acknowledgements
"We appreciate greatly that John K-J. Li and Glen M. Atlas read and edited the manuscript. We acknowledge that this article employs the existing logistic-based systolic model, developed by G.M.A, with a subtle modification to develop our logic and clinical application. Thus, out of our respect for the scrutinized work of G.M.A., the model in this article is still named as the logistic-based systolic model" (Frank, 2018).